Part of the Local Landscape
At Bartlams, we’re passionate about property, but we’re equally passionate about the communities we serve. That’s why w...


What is really happening in the UK housing market? How has it changed in Q1 compared to 2024?
If you look at this regional map, you’ll see that the number of homes sold subject to contract in Q1 2026, compared to Q1 2024, varies significantly across the country.
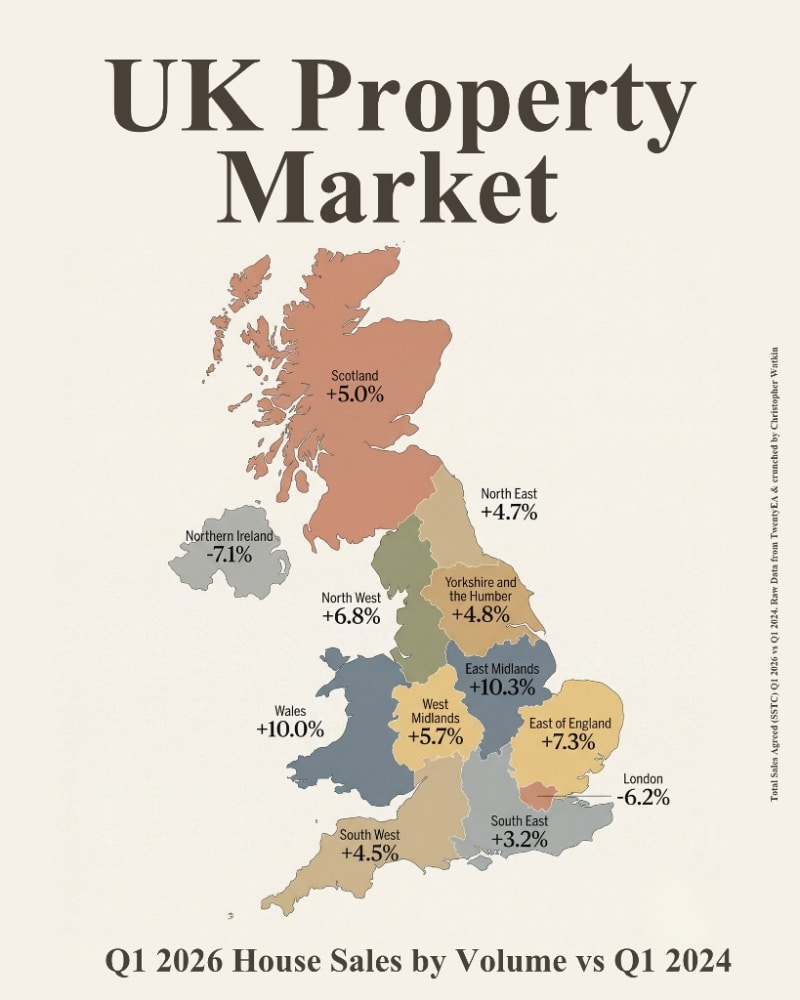
Here is how each region is performing, ranked from strongest to weakest:
• East Midlands: +10.3%
• Wales: +10.0%
• East of England: +7.3%
• North West: +6.8%
• West Midlands: +5.7%
• Scotland: +5.0%
• Yorkshire & the Humber: +4.8%
• North East: +4.7%
• South West: +4.5%
• South East: +3.2%
• London: -6.2%
• Northern Ireland: -7.1%
At first glance, the UK property market appears to be moving in the right direction, with most regions seeing an increase in agreed sales. The strongest growth is concentrated in the East Midlands and Wales, both delivering double digit rises, suggesting renewed confidence and steady buyer demand.
Across the Midlands, the North, and Scotland, the picture is one of stable, sustainable growth. These are not boom conditions, but nor are they weak. Instead, we are seeing a more measured, functional market, where realistic pricing and motivated buyers are key.
London, however, remains the outlier. Overall activity is down 6.2%, yet this headline figure hides a deeper story. Inner London has seen a sharper drop of 9.3%, while Outer London has been far more resilient, down just 1.5%. Affordability pressures and shifting buyer priorities continue to reshape the capital.
Yet even these regional figures only tell part of the story. When you drill down into individual towns and cities, the picture becomes even more nuanced. Within any one location, some areas will be performing strongly, while others are lagging. It becomes a patchwork, almost like a kaleidoscope, of micro markets.
There is no single UK property market. There are thousands of them.
Which raises the question; what do you think is happening to property in Wolverhampton right now, and how does it compare to a few years ago?
Thinking of selling your home or want to know what it’s worth? Click the link below to get an instant valuation:
https://bartlams.co.uk/property-valuation/
https://reports.spectre.uk.com/instant-valuations/9fc5ccf8-e03a-469c-bea0-54feaf0c852f

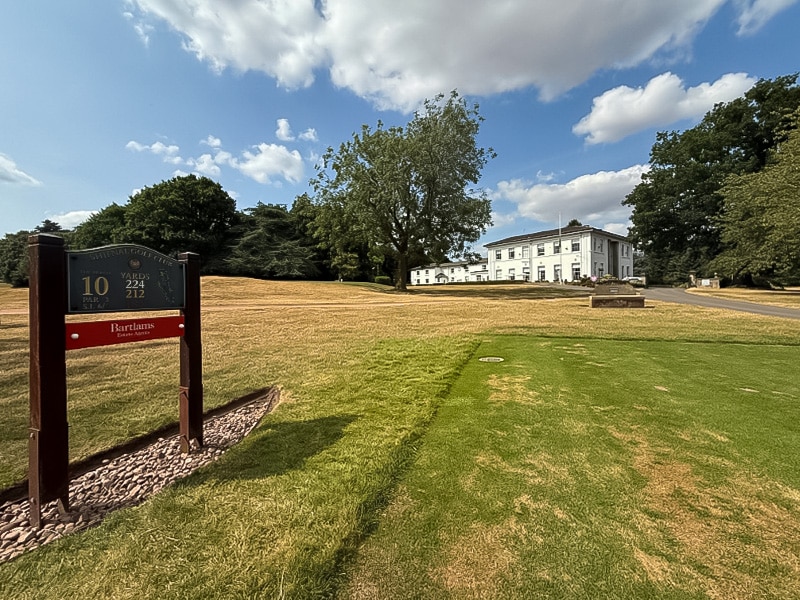
At Bartlams, we’re passionate about property, but we’re equally passionate about the communities we serve. That’s why w...
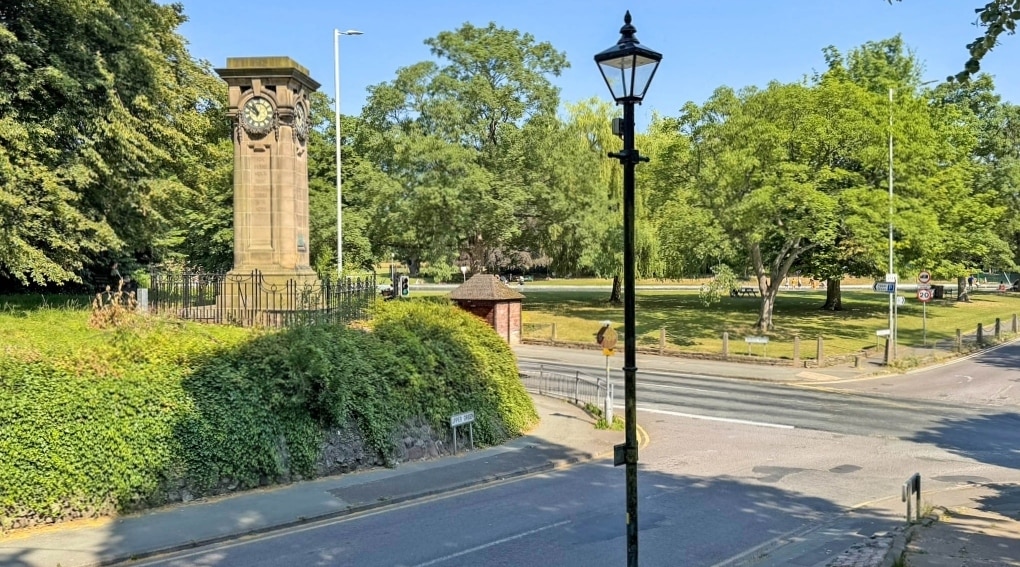
There is something special about Tettenhall in the summer months. As the days get longer and the weather warms up, the village
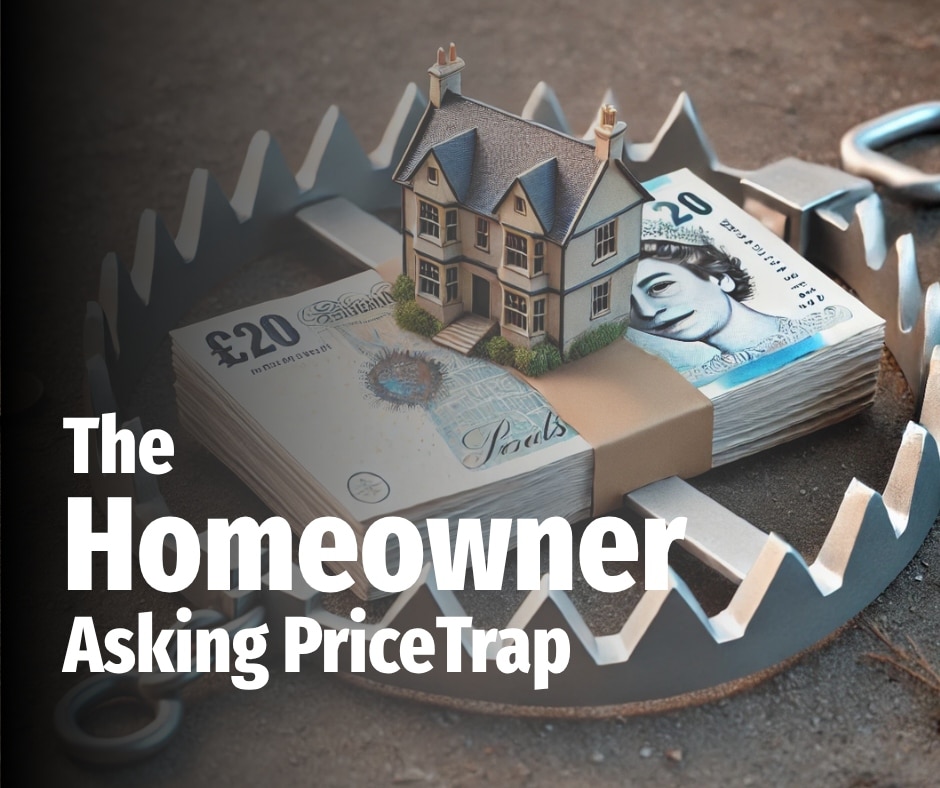
There is a quiet unspoken problem sitting inside the Wolverhampton property market. In the last two years, only 67.8% of the homes


